Music Team 5/2

IMG_3713
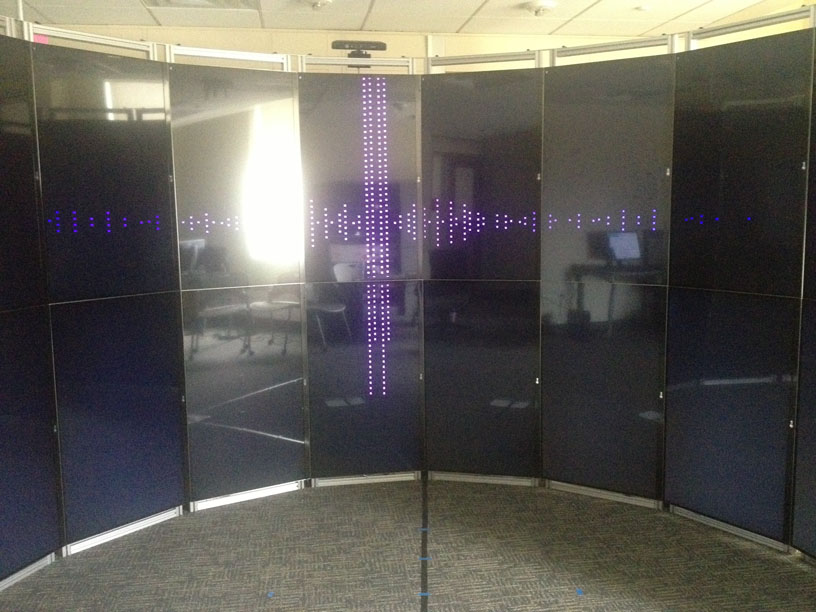
Simon: This week, with some help I got Fmod to work in the Discover system. The simulation now plays music and has a basic spectrum visualizer working.

Tim: I looked at the code for the texture packs.

Chelsi: I got video coverage and started to compile which videos we will alternate through in the video.

Accomplishments: This week we got the music analysis to work in real time. Also, we now have video footage to play in the background of the simulation. The model is simple now but can be made more complex later.

Problems: Everything actually went pretty smoothly this week. Learning textures in OpenGL is still challenging but otherwise mostly everything we want to do is implemented successfully.

Schedule: We are on schedule now that the music analyzer is working. Until class is over we will update what we have to make it fancier.

Next week: Put the video in the simulation, and add more details to the visualizer.


Music Team 4/25

IMG_3684


Simon: This week I coded some new shapes into the virtual environment and worked on different ways to change the colors and shapes. I also investigated some ways to use OpenAL in our program.

Tim: This week I have been trying to find a way to export data from a spectrogram of the song into a CSV. However I haven’t been able to find anything on the currentprogram that I am using. I tried unsuccessfully to find another program for the job. Next week I plan on finding more information about sonic visualizer and other
music analyzation software.

Chelsi: Chelsi is gone this week but is researching what type of sound system to get for our experiment. She also got some good background footage to use and is getting more this week.

Accomplishments this week: This week we implemented some more prototype environments and did color testing. Additionally, we tested some more music analysis features and decided on how we want to play recorded video in the environment.

Problems: The methods we have found for music analysis so far don’t really work. We still need to find a good program to use.

Schedule: We are behind schedule because the music features have yet to be implemented. All the other major parts of our program are mostly working.

Next week: Implement recorded video and some form of music analysis.

Music Team, 4/4

sphere1


Simon: worked on prototyping the virtual environment in OpenGL

Chelsi: worked on concepts and the music we will use

Tim: researched different ways to analyze the music

Accomplishments this week: A basic prototype of the environment was created. I wasn’t able to get as much done as I hoped because I couldn’t test in the lab, so many aspects of the program are still waiting on that. The final music file was acquired and we are on track to start analyzing the music.

Problems encountered: The lab computer crashed when I went to go use it, and I couldn’t test with the code I wanted to. Testing had to be done at home, which had many limitations. This meant that many of the more complicated parts of the program are still up in the air without being able to test in the lab.

Schedule: We are slightly behind schedule because our program is not running in the lab yet. The music analysis is still on schedule, we will decide on a method of analysis and implement it next week.

Next week: Beginning of music analysis. Testing in lab and adding more parts to the environment. More experimentation in OpenGL.

What Is The Resolution Of The Eye?

YouTube channel Vsauce posted this excellent video the other day. It explains lots of tricks and details about how our eyes work, including resolution and lots of fun illusions. It’s really handy for understanding how VR can make environments look immersive to the eye.

Data Visualization in VR

As far as data visualization in virtual reality goes, the New York Times’ Cascade system is one of the best examples I could think of. There’s a video on their site that provides a good overview – in short, the system tracks and models the spread of NYT articles as they’re shared across social media and other sites. or popular articles, this creates an immense amount of data. At the NYT R&D lab, this project exists on a multi-screen TV wall, perhaps the only way to effectively analyze all of its data at once. While not strictly virtual reality, I feel that big data tools like this one are perfect for VR environments; the large screen size and high resolution that VR offers is the best way to present this much data at once.

Also on the NYT labs site, there are more interesting projects, like an augmented-reality mirror. Projects like this are simple enough that I wouldn’t be surprised to see them become commonplace within the next few years.