Acid etching copper taffeta

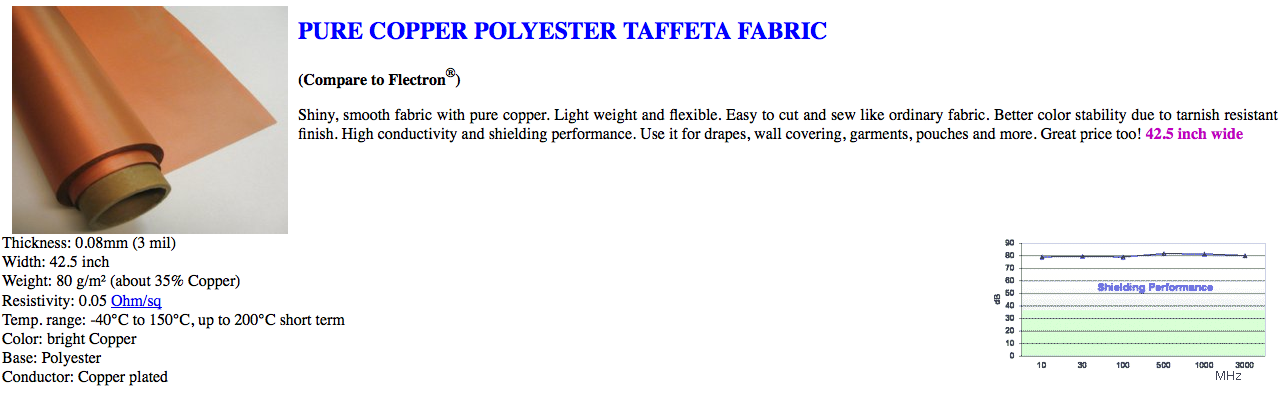
My first round of testing was etching conductive fabric to create circuits.  I’m working with a sample of copper-coated taffeta from LessEMF.

Working off of this tutorial, I began by screen printing a design onto my taffeta with a resist, in this case Vaseline.  I then soaked the taffeta in a vinegar & salt solution, which should etch away the unprotected copper coating, leaving behind the polyester fabric.  The tutorial suggested a minimum etching time of 12 hours, however there was no effect in that time so I left the taffeta in the etching solution for several days.

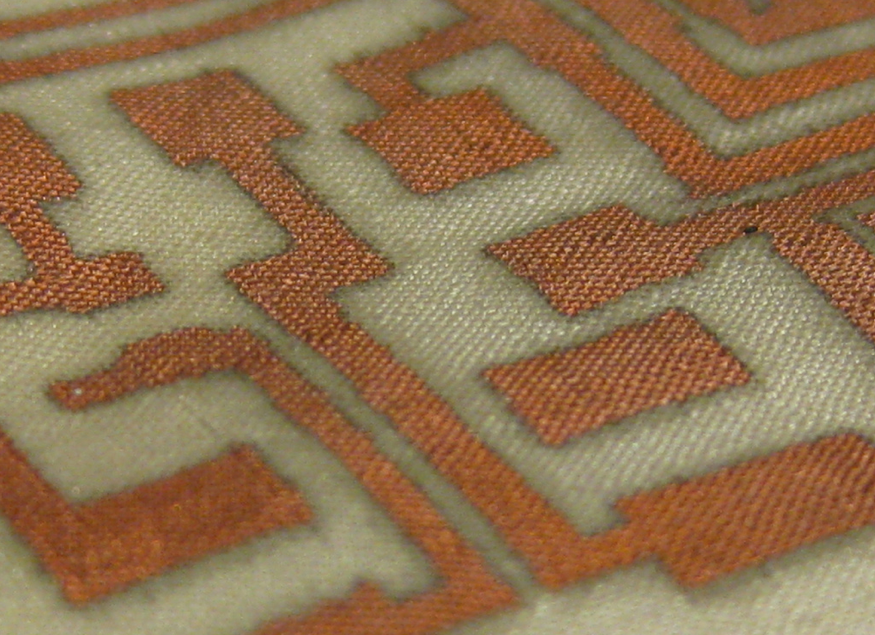
Here is my initial outcome:

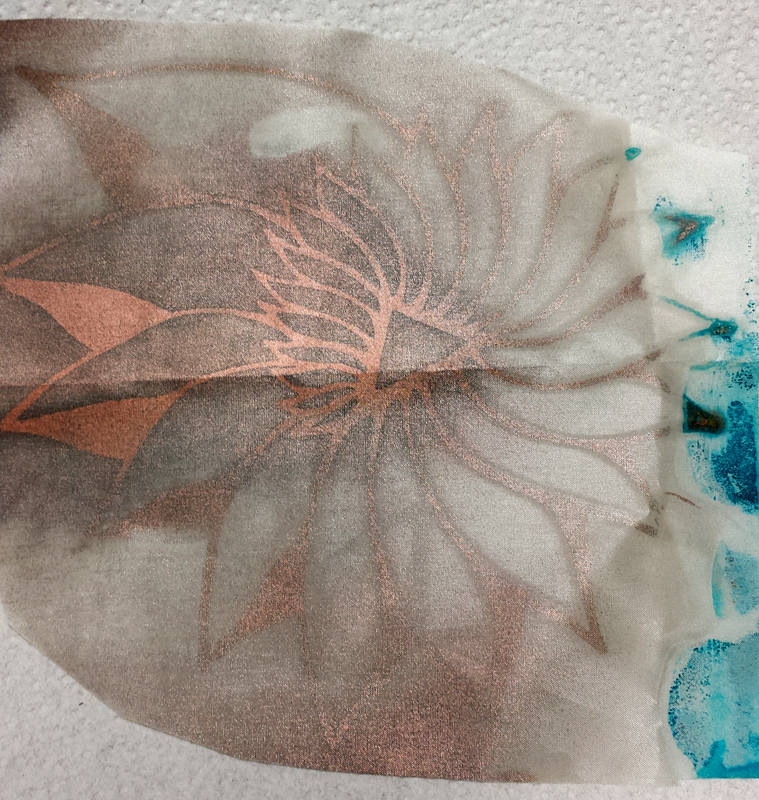
As you can see, while the fabric is etched, the outcome is less than perfect. There are a few variables I am refining for my next test:

1. Solution mix – While the tutorial calls for a ratio of 100ml vinegar to 7ml salt, I transposed things in my mind and tried to mix a solution of 100ml vinegar to 70ml salt.  Once I realized my error, I removed some of the excess salt.  However, I am uncertain what the makeup of my final solution was.

2. Salt type – For the initial experiment, I used pickling salt because it was what I had on hand.  For the next round I will be using standard iodized salt, in case the iodine content  factors into the etch.

3. Container – The first test was executed in a basic Tupperware bowl, which I quickly realized is not the ideal container given the delicate nature of the Vaseline resist.  Subsequent experiments will be conducted in a shallow pan.

4. Resist thickness – It may be beneficial to apply the Vaseline more liberally when printing, in order to better protect the copper from the etching solution.

Next steps:

I am going to put together a second round test, applying what I have learned from the initial experiment.  Once I get a clean etch, I am going to experiment with a few different dye formulations to see if it is possible to color the white taffeta without affecting the conductivity of the copper plating.  Also, I’d like to use a multimeter to test the conductivity across my etched design to start getting an idea of any potential size limitations.

Maps and Tiles

The files for the project are quite large, it takes about 5 minutes to save the largest files. (I know, I know, of course a 32k x 32k image is going to take a long time, what did you expect? Well, I expect my computer to be magical, that’s all. The images for various zoom stages are composed separately (using the same outline as the basis to maintain consistency) and I will be substituting more detailed renderings as needed for the appropriate levels of magnification. I had them grouped as layers for a very short period of time, until it was clear that additional layers seemed to exponentially increase the time required to save my file. This may seem like child’s play to an experienced programer, but I am enjoying learning about it.

In order to be most compatible with the google API, the images are made with these particular pixel dimensions:

256 x 256 ——— 1x magnification
512 x 512 ——— 2x
1024 x 1024 —— 4x
2048 x 2048 —— 8x
4096 x 4096 —— 16x
8192 x 8192 —— 32x (slightly smaller than the 40x equivalent magnification
16,384 x 16,384 — 64x
32,768 x 32,768 — 128x (slightly larger than the 100x equivalent magnification)

I do realize these won’t be precisely accurate, since the first onion image is not exactly at life size – but the 1024 size gets closer to the actual size so I am rounding the estimated measurements up one degree (so the 16,384 is closer to the “40x equivalent”, and the 32k image will be rendered slightly smaller than “100x equivalent”). This should not be an issue for the cricket and for the Paramecium, since the 256 x 256 should be more than enough space for “life size” (a single slide, in the case of the unicellular organism). For larger life forms in the future, these measurements will be adjusted accordingly.

Prof. Kevin Ponto found software for splitting images into ready-made tiles for use in Google Maps API formats: Maptiler Free online, which promises incredibly quick working time: (2 minutes as opposed to 122 minutes, and half the finished file size). This program has very good prospects but is limited to 10,000 px images and it leaves a watermark on the image that is tiled. I will try this one to see how it compares to another free version from Mike Courturier: Tile Generator – test map loading this weekend, hopefully.

Maptiler Start: The next level (costs ~$28 USD, not bad) does not put a watermark on, but it is still limited to 10k pixels and requires(maybe?) 2 CPU cores. That end size will bring us to approximately 40x zoom, which equates to the lowest lens on a standard compound microscope. I have been developing the drawings at 32,768px, which gets me slightly above 100x magnification, which would be ideal. The highest level of magnification would be 400x magnification, but that may be reserved for the Paramecium… (which I probably should have started with, being a single-celled organism…)

Maptiler Pro: The next (and most expensive level at ~$560 USD) offers unlimited size, so I could get the zoom I want, but in addition to the hefty price tag it requires (maybe?) 4 CPU processors.

I think I’m willing to wait a few hours for images to tile. We’ll see though, perhaps a step up would be worth it.

Also posted on jwhisenant.wordpress.com

Conversations and Reference Sources

I have had several helpful conversations over the past week, and there have been many good thoughts and suggestions regarding this project.

Kandis Elliot – Scientific Illustrator: Botany Dept./Zoology Dept. 
Kandis had lots of advice and was very generous about sharing her process when approaching scientific illustration – after meeting with her I immediately went and made a reference sheet for Photoshop keyboard shortcuts (I knew the basics, but when you are able to fly through the toolset, it cuts your work time down significantly). We talked about information design, image rendering, and dinosaurs!

Sarah Friedrich – Scientific Illustrator and Media Specialist: Botany Dept.
It was very fun to speak with Sarah (after I went to the correct floor…) It is incredibly helpful to explain the scope of a project to different people, even just to articulate my own thought process out loud, as well as hearing alternate perspectives. We talked about layers of design (especially for organisms with multiple systems to represent: digestive/nervous/endocrine/etc) and were tossing around ideas of how that might be approached as a layering process to integrate the system representation, or if they would be completely separate.

Mike Clayton – Photographer/Collection Manager: Botany Dept.
An incredible resource for imaging suggestions – and generously offered the use of the Botany Dept compound microscope with a screen viewer, on Fridays. In addition to the comprehensive resources of the UW, he recommended looking for existing slides from Ripon Microslide for any specific botanical material. He has also compiled some fantastic images of plant material using a nice quality flatbed scanner (one of the many helpful tips: for 3D objects that you don’t want smashed against the glass: scan with an open top in a dark room – the resulting images are dramatically lit with a deep black background).

Some images from the UW collections: excellent reference points for 40x versus 100x magnification. Right now the only available slides are of root tips, so I am growing an onion from a common bulb in order to get leaf cell samples… (I had one in the kitchen but my industrious housemate discarded it… oh well) For the actual rendering, I am drawing one root’s worth and use it for the other root tips as well, adjusting for different curves, etc).

Image from UW Botany Department, scanned by Mike Clayton

Onion_UWBotanyDept_AlliumRootMetaphaseSpindle

Marianne Spoon – Chief Communications Officer, Science Writer for the Wisconsin Institute of Discovery
We met to go over the scope and plans for this project. Marianne had some great presentation format suggestions – I had been focusing mainly on the individual images but she was talking about how viewers might encounter the image options on a hypothetical website (i.e. possibly in a compiled image with hotspots on an where people could click on an onion/cricket/etc and then go to the zoomable map view. She was also wondering if the image would go even farther out, zooming out to a room, a building, a country, a planet. Perhaps something to consider in the future – maybe seamlessly link to a separate zoom map, since my files are getting quite large just from a “lifesize” viewpoint! She made me really start thinking about the larger integration of these anatomical maps into their intended application or something that I might not have anticipated!

In other news, I have several reference drawings from our entomology lab cricket dissections last week, so I have started compiling initial sketches of the internal systems for an upcoming map.

(also posted on jwhisenant.wordpress.com)

Exploring leap motion integration with Zspace

For my independent study project, I am interested in adding an additional input to the ZSpace, called Leap Motion. The ZSpace is a holographic display  and allows the user to manipulate the object (via a stylus) in the virtual environment as if the object were right in front of them. By integrating the Leap Motion device, I hope to bring a more natural way to manipulate the object by using both hands.

Specific hand gestures are still being though of, but I envision that the Leap Motion could also draw objects it self via the index finger.


Leap Motion

ZSpace

eTextiles Project Proposal & Timeline

Topics:

The main area I would like to pursue in this independent study is a deeper dive into the integration of textiles and technology. Some possibilities I would like to explore include:

  • Creating fiber/textile sensors

  • Nitinol “muscle” wire

  • Conductive textiles

  • Screen printing conductive paint

  • Acid etching copper taffeta

I would also like to refine the programming on my existing Arduino projects (the Moodie and the Robe a la Foudre) and do more explorations into the application of biometric sensor data to my designs.

Final Project(s):

I will do some exploration and experimentation of each technique before choosing the 3 most successful/relevant techniques. I will then expand each of the 3 techniques into a small “proof of concept” project that is suitable for exhibition.

Calendar:

Week 1 [2/3 – 2/9]

  • Order supplies

  • Test vinegar etching on copper taffeta

Week 2 [2/10 – 2/16]

  • Spinning conductive fibers

  • Knit/crochet conductive yarn

Week 3 [2/17 – 2/23]

  • Continue knit/crochet sensor experiments

  • Test options with other conductive textiles

  • weaving?

Week 4 [2/24 – 3/2]

  • Test nitinol wire uses/limitations

Week 5 [3/3 – 3/9]

  • Test conductive paint screen printing

  • Test screen printing resist on copper taffeta

Week 6 [3/10 – 3/16]

  • Test dyeing etched copper taffeta

  • vast disperse dye vs. heat set

Week 7 [3/17 – 3/23]

  • Project 1 begin

Week 8 [3/24 – 3/30]

  • Project 1 cont.

Week 9 [3/31 – 4/6]

  • Project 1 completed

  • Project 2 begin

Week 10 [4/7 – 4/13]

  • Project 2 (cont.)

Week 11 [4/14 – 4/20]

  • Project 2 completed

Week 12 [4/21 – 4/27]

  • Project 3 begin

Week 13 [4/28 5/4]

  • Project 3 (cont.)

Week 14 [5/5 5/9]

  • Project 3 completed

Frontier Fellow Project: In Focus Anatomy

In Focus Anatomy (working title)

Through the Wisconsin Institute for Discovery, I will be developing anatomically accurate drawings that will be structured with a “google-map” type of interface, functioning as a virtual microscope. This interactive educational tool will allow the viewer to zoom in to the cellular level on a variety of contrasting organisms, encouraging an active investigation of various life forms.

First image in progess: Onion (Allium)

Start out with basic drawing, then use the outline to guide the higher-detail and the cellular level stages. I will be visiting the Dept. of Botany’s collection in the next few days to look at Allium root slides for reference, to ensure a more accurate depiction of cellular construction.

Project in development: test map will be up very soon!

ReKinStruct – Abstract & First Look

Kinects are generally used to obtain depth maps of an environment using their speckle pattern reflection of infrared light and a color pattern similar to a video camera. This data is used to analyze the position and movement of human body thus giving a virtual reality gaming environment. Contrary to the above traditional use of Kinects, they can be used to obtain 3D Point Clouds similar to the usage of a LiDaR scanner. The striking difference between the Kinect and LiDaR scanning would be that a Kinect could be moved in any direction and still continues to obtain the Point Cloud Data while the LiDaR scanner has to be kept stationary during its operation. The Point Cloud Data obtained can be simultaneously or subsequently processed to enhance, reconstruct missing points and texturize the data obtained and can also serve as a map for SLAM (Simultaneous Localization and Mapping). The Point Cloud Library(PCL) and C++ are to be used almost for the entire process. OpenCV, OpenNI are the next likely frameworks.

And to get this project kicked off, I got Windows, Visual Studio and Kinect SDK installed on my Mac (It took much longer than I thought). With a little help from the Kinect SDK apps, I was able to obtain the color and depth maps of my laptop inside my laptop inside my laptop inside. . .

Voila.!

From here, the next step would be obtain a continuous point cloud from the Kinect which would get us something like a 3D image. And from there, it all looks exciting.

Naveen